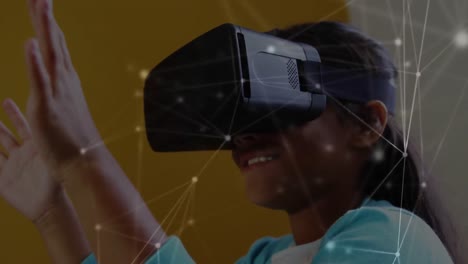
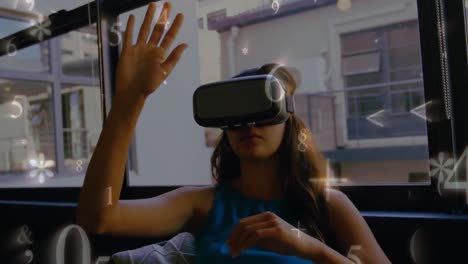
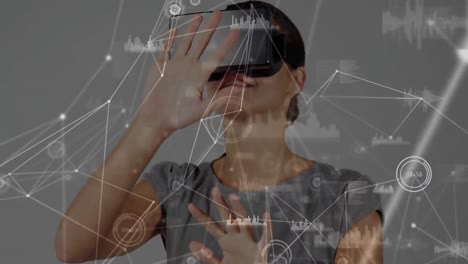
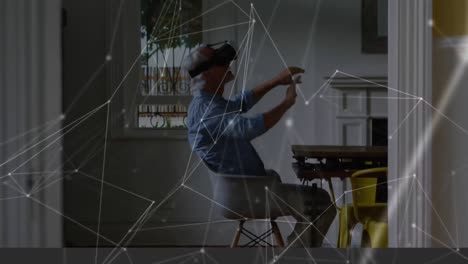
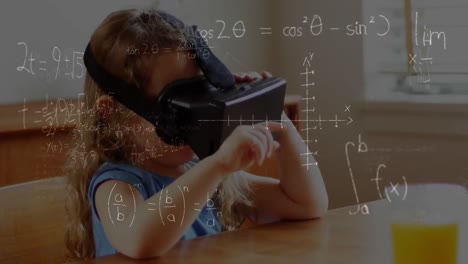
Analysis Motion Graphics
0 clips
Sorry, no clips were found! Browse
Sponsored by iStock
LIMITED DEAL: Save 20% on 4K Video from iStock
Close-up asia business people meeting plan analysis statistics brainstorm and header of team hold tablet pointing graph chart and employee take note.
Company Operations Manager Holds Meeting Presentation for a Team of Economists. Adult Male Uses TV Screen with Growth Analysis, Charts, Statistics and Revenue. People Work in Business Office.
Finance business women talking and looking at data, stats and a graph on a computer screen while working late at night in an office. Female colleagues analysing a chart and trading stock online
Analyzing Digital Data - Gold Colored Version, Loopable - Statistics, Financial Chart, Economy
Female eyes in eyeglasses late at night scrolling in front of laptop. Coder, she checking Bitcoin price chart on digital exchange on smartphone.
Diverse Team Of Data Scientists Having A Meeting And Discussing Reports In a Modern Monitoring Office With Analytics Feed On a Big Digital Screen. Deep Learning Company With Employees Behind Computers
Business, finance and economy professionals looking at the financial income and expense of the company on a computer screen. Female traders working and collaborating overtime to meet a deadline
graphs and charts across a screen showing data visualizations and information Loop Background.
Two colleagues Business people working on global financial strategy using tablet and laptop
Professional IT Programer Working in Data Center on Desktop Computer with Three Displays, Doing Development of Software and Hardware. Displays Show Blockchain, Data Network Architecture. Back View
Asian businesswoman collaboration with Black ethnic businessman in modern office working space
Two Professional IT Programers Discussing Blockchain Data Network Architecture Design and Development Shown on Desktop Computer Display. Working Data Center Technical Department with Server Racks
Closeup group of Asian business people meeting discuss project plan and financial results in office. Marketing strategy analysis, stock market trading, financial consultant.
Different UI, UX, GUI mobile screens modern infographic. Template dashboard infographic, charts, graph and graphic UI, UX, KIT elements. Info chart elements for online statistics and data analytics.
Chief Industrial Engineer Has Meeting with Management and Executives in the Heavy Industry Factory Have Quarterly Meeting Room, They Look at Production Statistics on a Big Screen.
Diverse Office Conference Room Meeting: Charismatic Black Digital Entrepreneur Presents e-Commerce Fintech Growth Statistics to a Group of Investors. Wall TV with Big Data Analysis, Infographics
Diverse Group of Professionals Meeting in Modern Office: IT Programmers Use Computer, Talk Strategy, Discuss Planning. Software Engineers Develop Inspirational App. Rack Focus Computers to People
Indian Male Data Scientist And Caucasian Female Business Manager Talking In Front Of Big Digital Screen With Graphs, Charts And Map In Monitoring Office. Diverse Colleagues Discussing Objectives.
Diverse Office: Indian IT Programmer Working on Desktop Computer. Female Specialist Creating Innovative Software. Engineer Developing App, Program, Video Game. Writing Code in Terminal. Arc Shot
Close-up Hand of Business person team using Digital tablet analyzing Business Data Financial analysts see charts and graphs on digital tablet
Close-up or closeup of young woman's hand is using a tablet and stylus to check details of financial budget
Business man, glasses and reading on computer in programming, software or information technology solution. Professional programmer or manager start working on laptop for IT problem solving or results
Modern Multi-Ethnic Office Conference Room Meeting: Diverse Team of Young Entrepreneurs, Specialists Talk, Use TV for infographics. Businesspeople Discuss Investment Strategy for e-Commerce Startup
Close up of paperwork and hands on a board room table at a business presentation or seminar. The documents have financial or marketing figures, graphs and charts on them.
Female Developer and Male Statistician Use Interactive Whiteboard Presentation Touchscreen to Look at Charts, Graphs and Growth Statistics. They Work in the Stylish Creative Office.
4k Flying Through An Emerging Network (Blue) - Loopable - Artificial Intelligence, Blockchain, Big Data, Network Security, Connections
Female Top Manager and Male Businessman Sitting at the Desk Having Discussion and Working on a Desktop Computer, Solving Problems. Successful People in Modern Stylish Office with Big City Business District View.